Methods: The expression levels of TFRC were downloaded from The Cancer Genome Atlas (TCGA) and GTEx databases, the TFRC expression patterns and immunological effects were assessed by pan-cancer analysis, and the results were validated in the GEO and Oncomine datasets. Then, the expression data of TFRC in PAAD were assessed by prognostic survival analysis (overall survival (OS), disease-free survival (DFS), progression-free survival (PFS), and disease-specific survival (DSS)). Subsequently, the correlation of TFRC with factors that reflect the tumorigenicity of the tumour microenvironment, including immune scores, immune checkpoints, tumour-infiltrating immune cells, tumour mutation burden (TMB), microsatellite instability, ferroptosis level, and m6A levels, was assessed. In addition, the clinicopathological features of TFRC and the risk score in PAAD were combined to establish a clinical nomogram and construct a calibration curve for validation. Finally, gene set enrichment analysis (GSEA) was performed to visualize the signalling pathways by which TFRC affects PAAD.
Results: The expression of TFRC was significantly increased in PAAD tissues compared to normal pancreatic tissues. Kaplan-Meier survival analysis showed that PAAD patients with high levels of TFRC had shorter survival than did those with lower levels of TFRC. TFRC expression was associated with different tumour-infiltrating immune cells in PAAD and with factors such as lymph node metastasis and a history of alcohol consumption. The results of the univariate and multivariate Cox regression analyses showed an association of TFRC with prognosis in PAAD patients. GSEA suggested that TFRC acts on pathways related to endothelial cell proliferation and blood vessel endothelial cell migration.
Conclusions: TFRC is a potential prognostic indicator and a novel therapeutic target for human PAAD.
Introduction
Pancreatic adenocarcinoma (PAAD) is one of
the deadliest gastrointestinal malignancies, with approximately 338,000
pancreatic cancer patients surveyed worldwide in 2012 [1]. Difficulties in
early detection and susceptibility of PAAD to metastasis lead to poor prognosis
of pancreatic cancer [2]. One study reported that the incidence of pancreatic
cancer continues to rise globally, and it is predicted that pancreatic cancer
will be the second leading cause of cancer-related death in the US by 2030 [3].
The strong chemoresistance of PAAD poses significant challenges to extending
patient survival, and effective treatments are still limited [4-5]. Therefore,
there is an urgent need to explore the molecular targets with regard to the
prognosis and treatment if PAAD patients.
TFRC, also known as CD71, is a membrane
protein that regulates intracellular iron transport. Recently, an increasing
number of studies have shown that TFRC overexpression in certain malignancies
plays an important role in tumour development [6-7]. TFRC promotes epithelial
ovarian cancer cell proliferation and metastasis [7], and epigenetic silencing
of the TFRC gene reduces the growth and survival of hepatocellular carcinoma
(HCC) cells [8]. However, the role of TFRC in PAAD remains unclear.
In this study, we observed a significant
increase in the expression of TFRC in PAAD patients from The Cancer Genome
Atlas (TCGA), Oncomine and GEO databases. This overexpression is associated
with a poor prognosis of PAAD. At the same time, our study showed that high
TFRC expression was significantly associated with lymphnode metastasis.
Furthermore, we performed an enrichment analysis and visualized the signalling
pathways enriched by TFRC in PAAD.
Methods
Data source and processing
We performed
mapping from the TCGA (https://cancergenome.nih.gov/) [9] and Genotype Tissue
Expression (GTEx) (https://gtexportal.org/) databases, and TFRC expression in
multiple cancers was analysed using R software v4.0.3 [10]. We also used the
Oncomine database [11] to further validate the difference in TFRC expression
between PAAD patients and healthy individuals, and a P-value cut-off value of
0.05 was considered statistically significant.
Survival
analysis
We analyzed the
relationship between TFRC expression and overall survival (OS) and
disease-specific survival (DSS) in multiple cancers by using the R packages
survminer with samples from the TCGA database. The relationship between OS,
DSS, progression-free survival (PFS) and disease-free survival (DFS) with in
PAAD using univariate Cox regression analysis and P values, risk coefficient,
hazard ratio (HR) and confidence intervals are visualized by forest plots. We
considered P <0.05 in the univariate Cox to be statistically significant. In
addition, we investigated the association between TFRC expression and
clinicopathological features with Fisher’s exact test and drew a three-line
table.
Analysis of the tumour microenvironment
To determine the effect of TFRC on immune infiltration in PAAD, we
conducted an immune score assessment and immune checkpoint analysis using the
TCGA dataset of PAAD patients with R software by R (v4.0.3) [12-15].
Correlation of TFRC expression with various immune cells was performed with the
R package ggstatsplot [16]. Next, we analysed the correlation of tumour
mutation burden (TMB) and microsatellite instability with TFRC expression in
PAAD using the R software package fmsb. In addition, we performed apoptosis and
RNA methylation modification (m6A) analysis and further
validated our results with the PAAD patient dataset from the GEO database
[17-18]. We considered a P-value cut-off of 0.05 to be statistically
significant. All the above analyses were implemented using the R software
packages ggplot2 and pheatmap.
Gene set
enrichment analysis (GSEA)
GSEA is a
computational method that correlate gene expression data with diseases or drug
response [19]. In this study, all the specimens from PAAD patients were sorted
by TFRC expression levels classified into high and low expression groups based
on the median amount of TFRC expression. Genome arrangements were set to 100
times and filtered by their nominal p values and normalized enrichment scores
(NESs). The R software package limma, h.eg.db, clusterProfiler, enrichplot and
gglot2 were applied to visualize the data. A P-value of 0.05 was statistically
significant.
Statistical analysis
Univariate and
multivariate Cox regression analyses were used to assess the prognostic
significance of TFRC expression in PAAD patients. We presented the variable P
values, risk coefficient HRs and confidence intervals with the R package
forestplot and using forest plots. The results of multivariate Cox proportional
risk analysis were produced using the “rms” R package, and nomograms were
generated. The nomogram can not only predict the total 3-year relapse rate but
also graphically represent these factors, and the prognostic risk for
individual patients can be determined by calculating the points associated with
each risk factor [20-21].
Results
Pan-cancer expression pattern and survival correlation
We analysed the TFRC expression data from the TCGA and GTEx databases and showed that TFRC was highly expressed in multiple tumour tissues, especially in PAAD tissues (Figure 1A). To further validate our findings from these databases, we used the Oncomine database for analytical comparison and reported significant differences in TCGA expression between normal tissues and tumour tissues from PAAD patients (Figure 1B). These results suggest that TFRC expression is upregulated in PAAD patients. Next, we investigated the prognostic significance of TFRC expression in human tumours. We performed OS analysis using the “survival” package in the R project and found that high expression of TFRC predicted poor PAAD prognosis (Figure 1C) (p=0.020) with decreased OS with increasing TFRC expression; however, this correlation was not observed in other tumours (Figure 1E-G). Therefore, we further analysed the role of TFRC in PAAD using the Cox regression model. The results showed that TFRC is a high-risk factor for PAAD occurrence (Figure 1H).
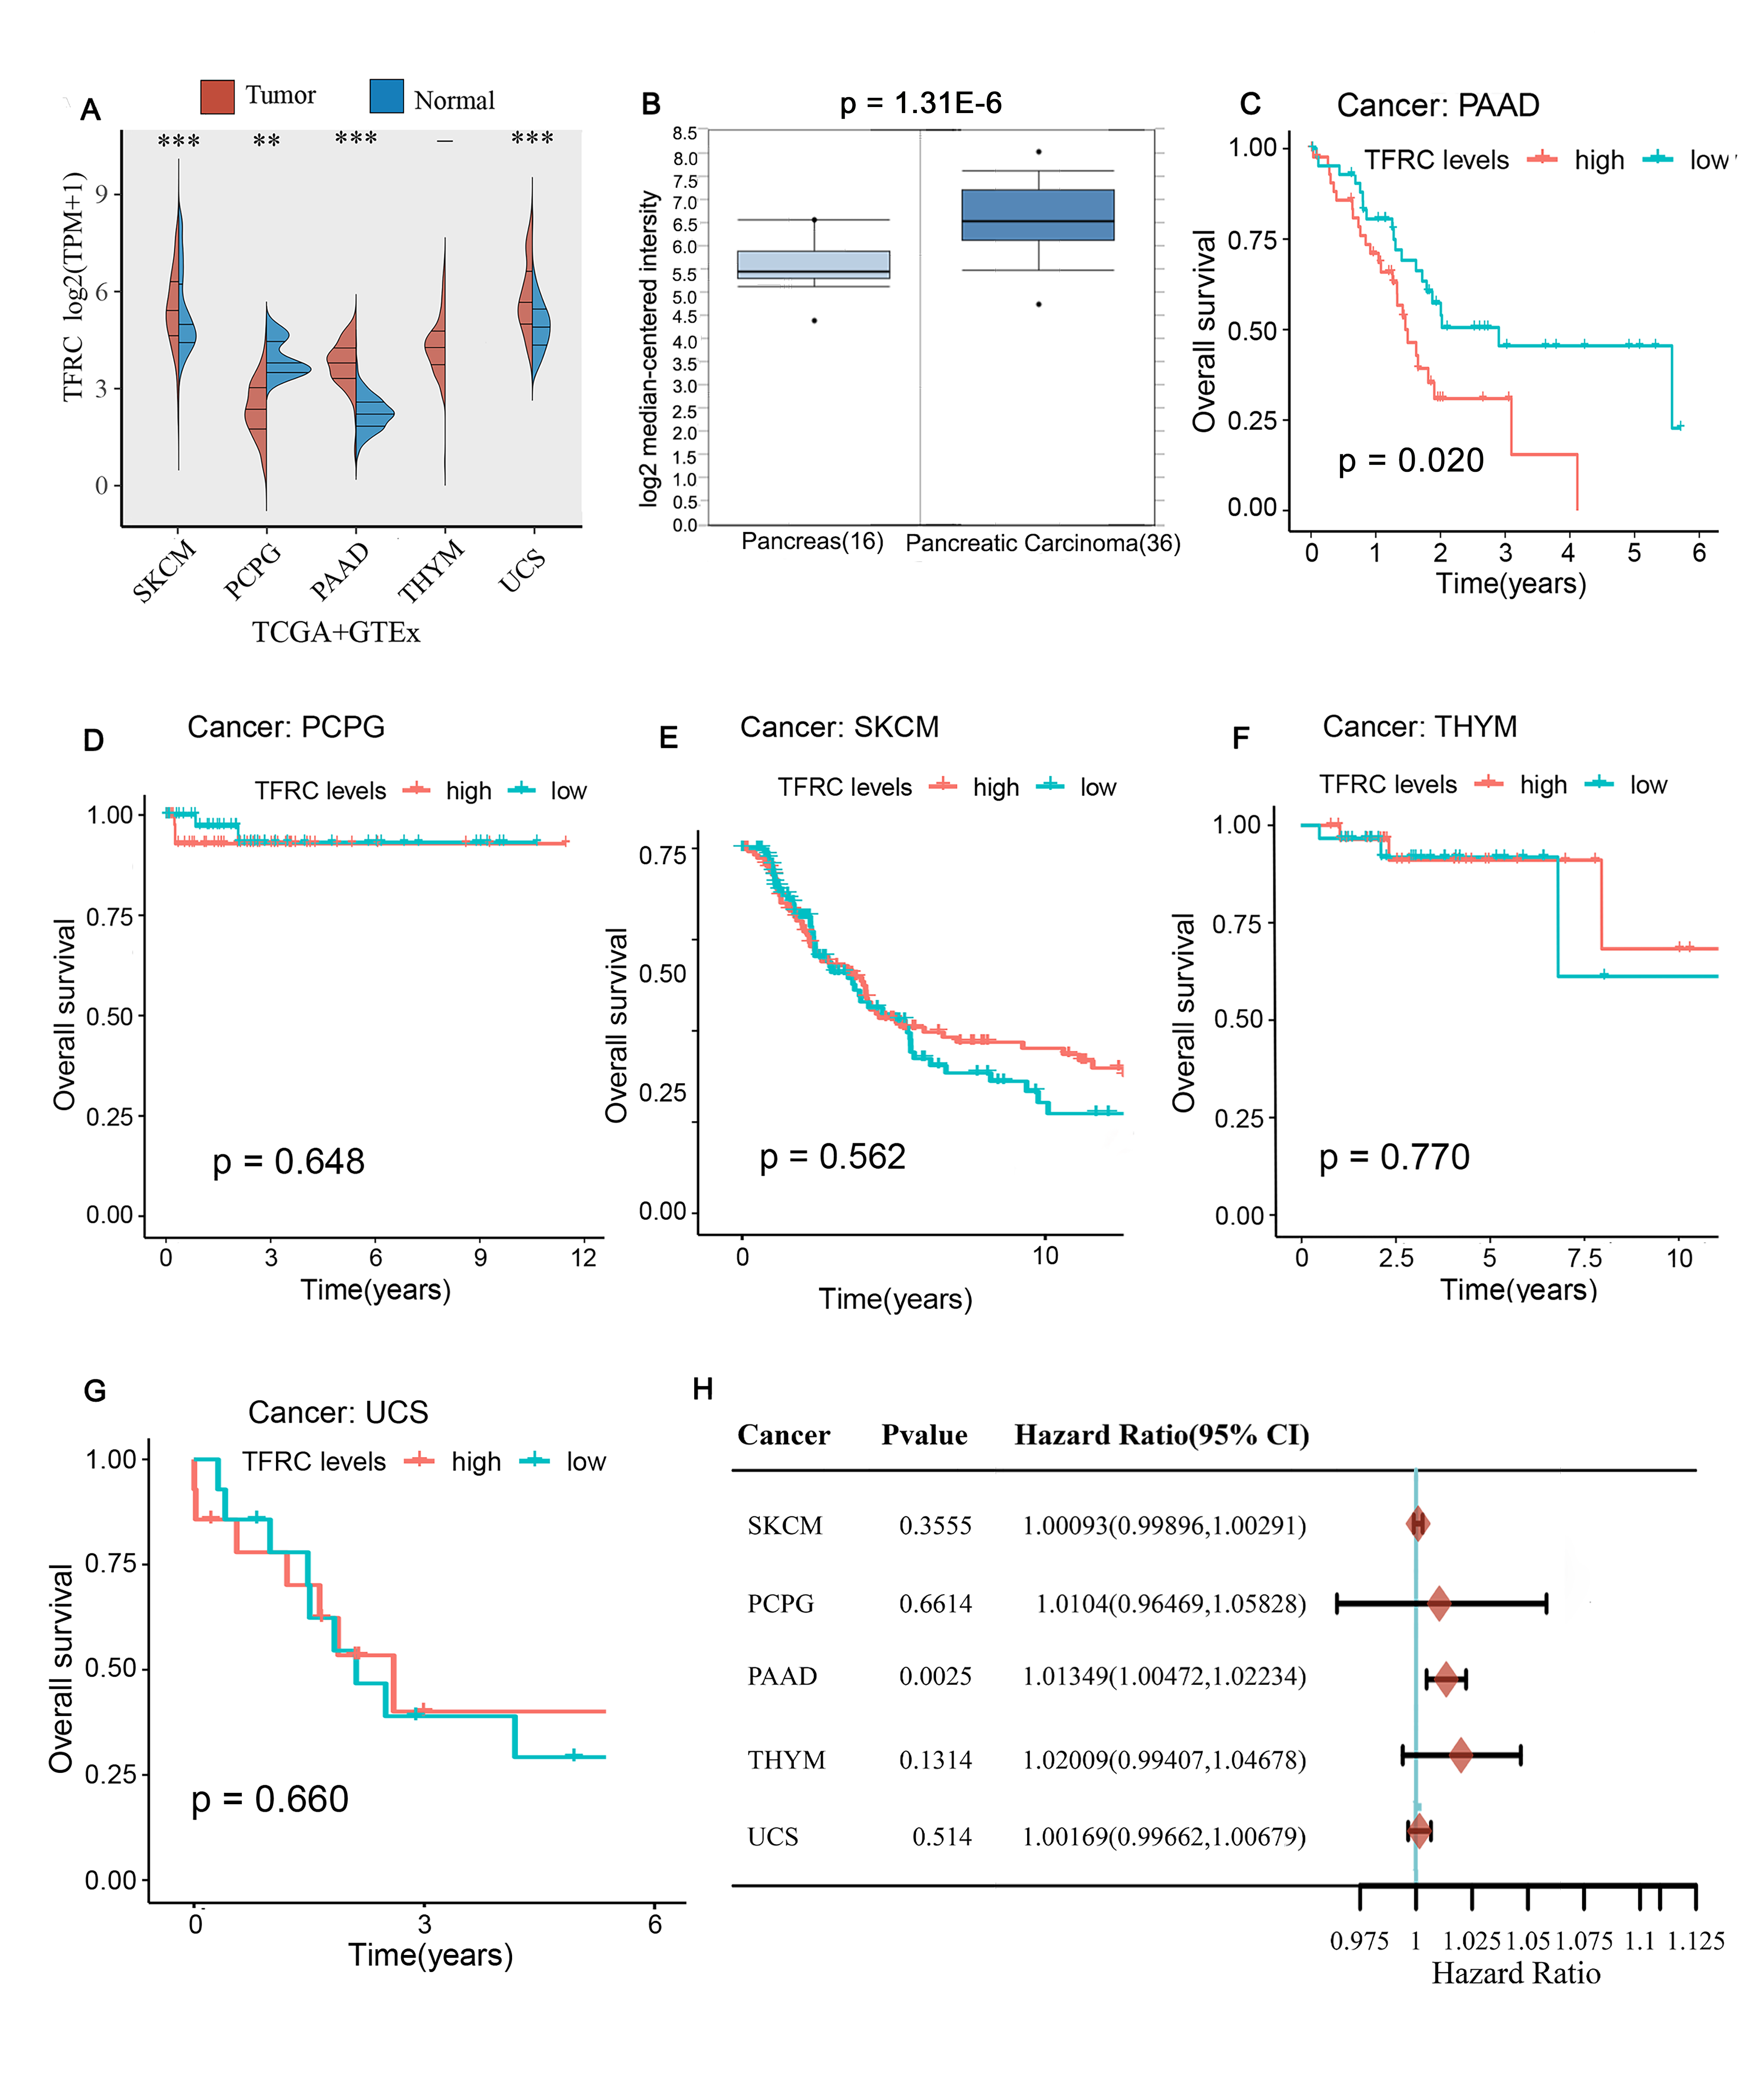
Figure 1. The expression of TFRC in different cancers and
comparison of OS survival curves of TFRC high and low expression in different
cancers. A: TFRC expression of different tumor types in the TCGA and GTEx
database. B: TFRC level in PAAD tissues compared to normal tissues in the
Oncomine database. (C-G) Comparison of OS survival curves of TFRC high and low
expression in PAAD(C), PCPG(D), SKCM (E), THYM (F) and UCS(G). H: Prognostic HR
of TFRC in different cancers for OS.
We then studied PAAD samples using different survival analyses. Kaplan-Meier analysis of PAAD samples from the TCGA database revealed that high levels of TFRC were significantly associated with OS (Figure 2A) (p = 0.025) but not with PFS (p= 0.318). However, when performing Cox analysis, we found that the P values of DSS, DFS, and PFS derived from Cox analysis were less than 0.05, with HR values greater than 1 (Figure 2B-D), indicating that TFRC expression was associated with the survival of PAAD patients, was a high-risk factor for PAAD and could serve as a prognostic biomarker of PAAD.
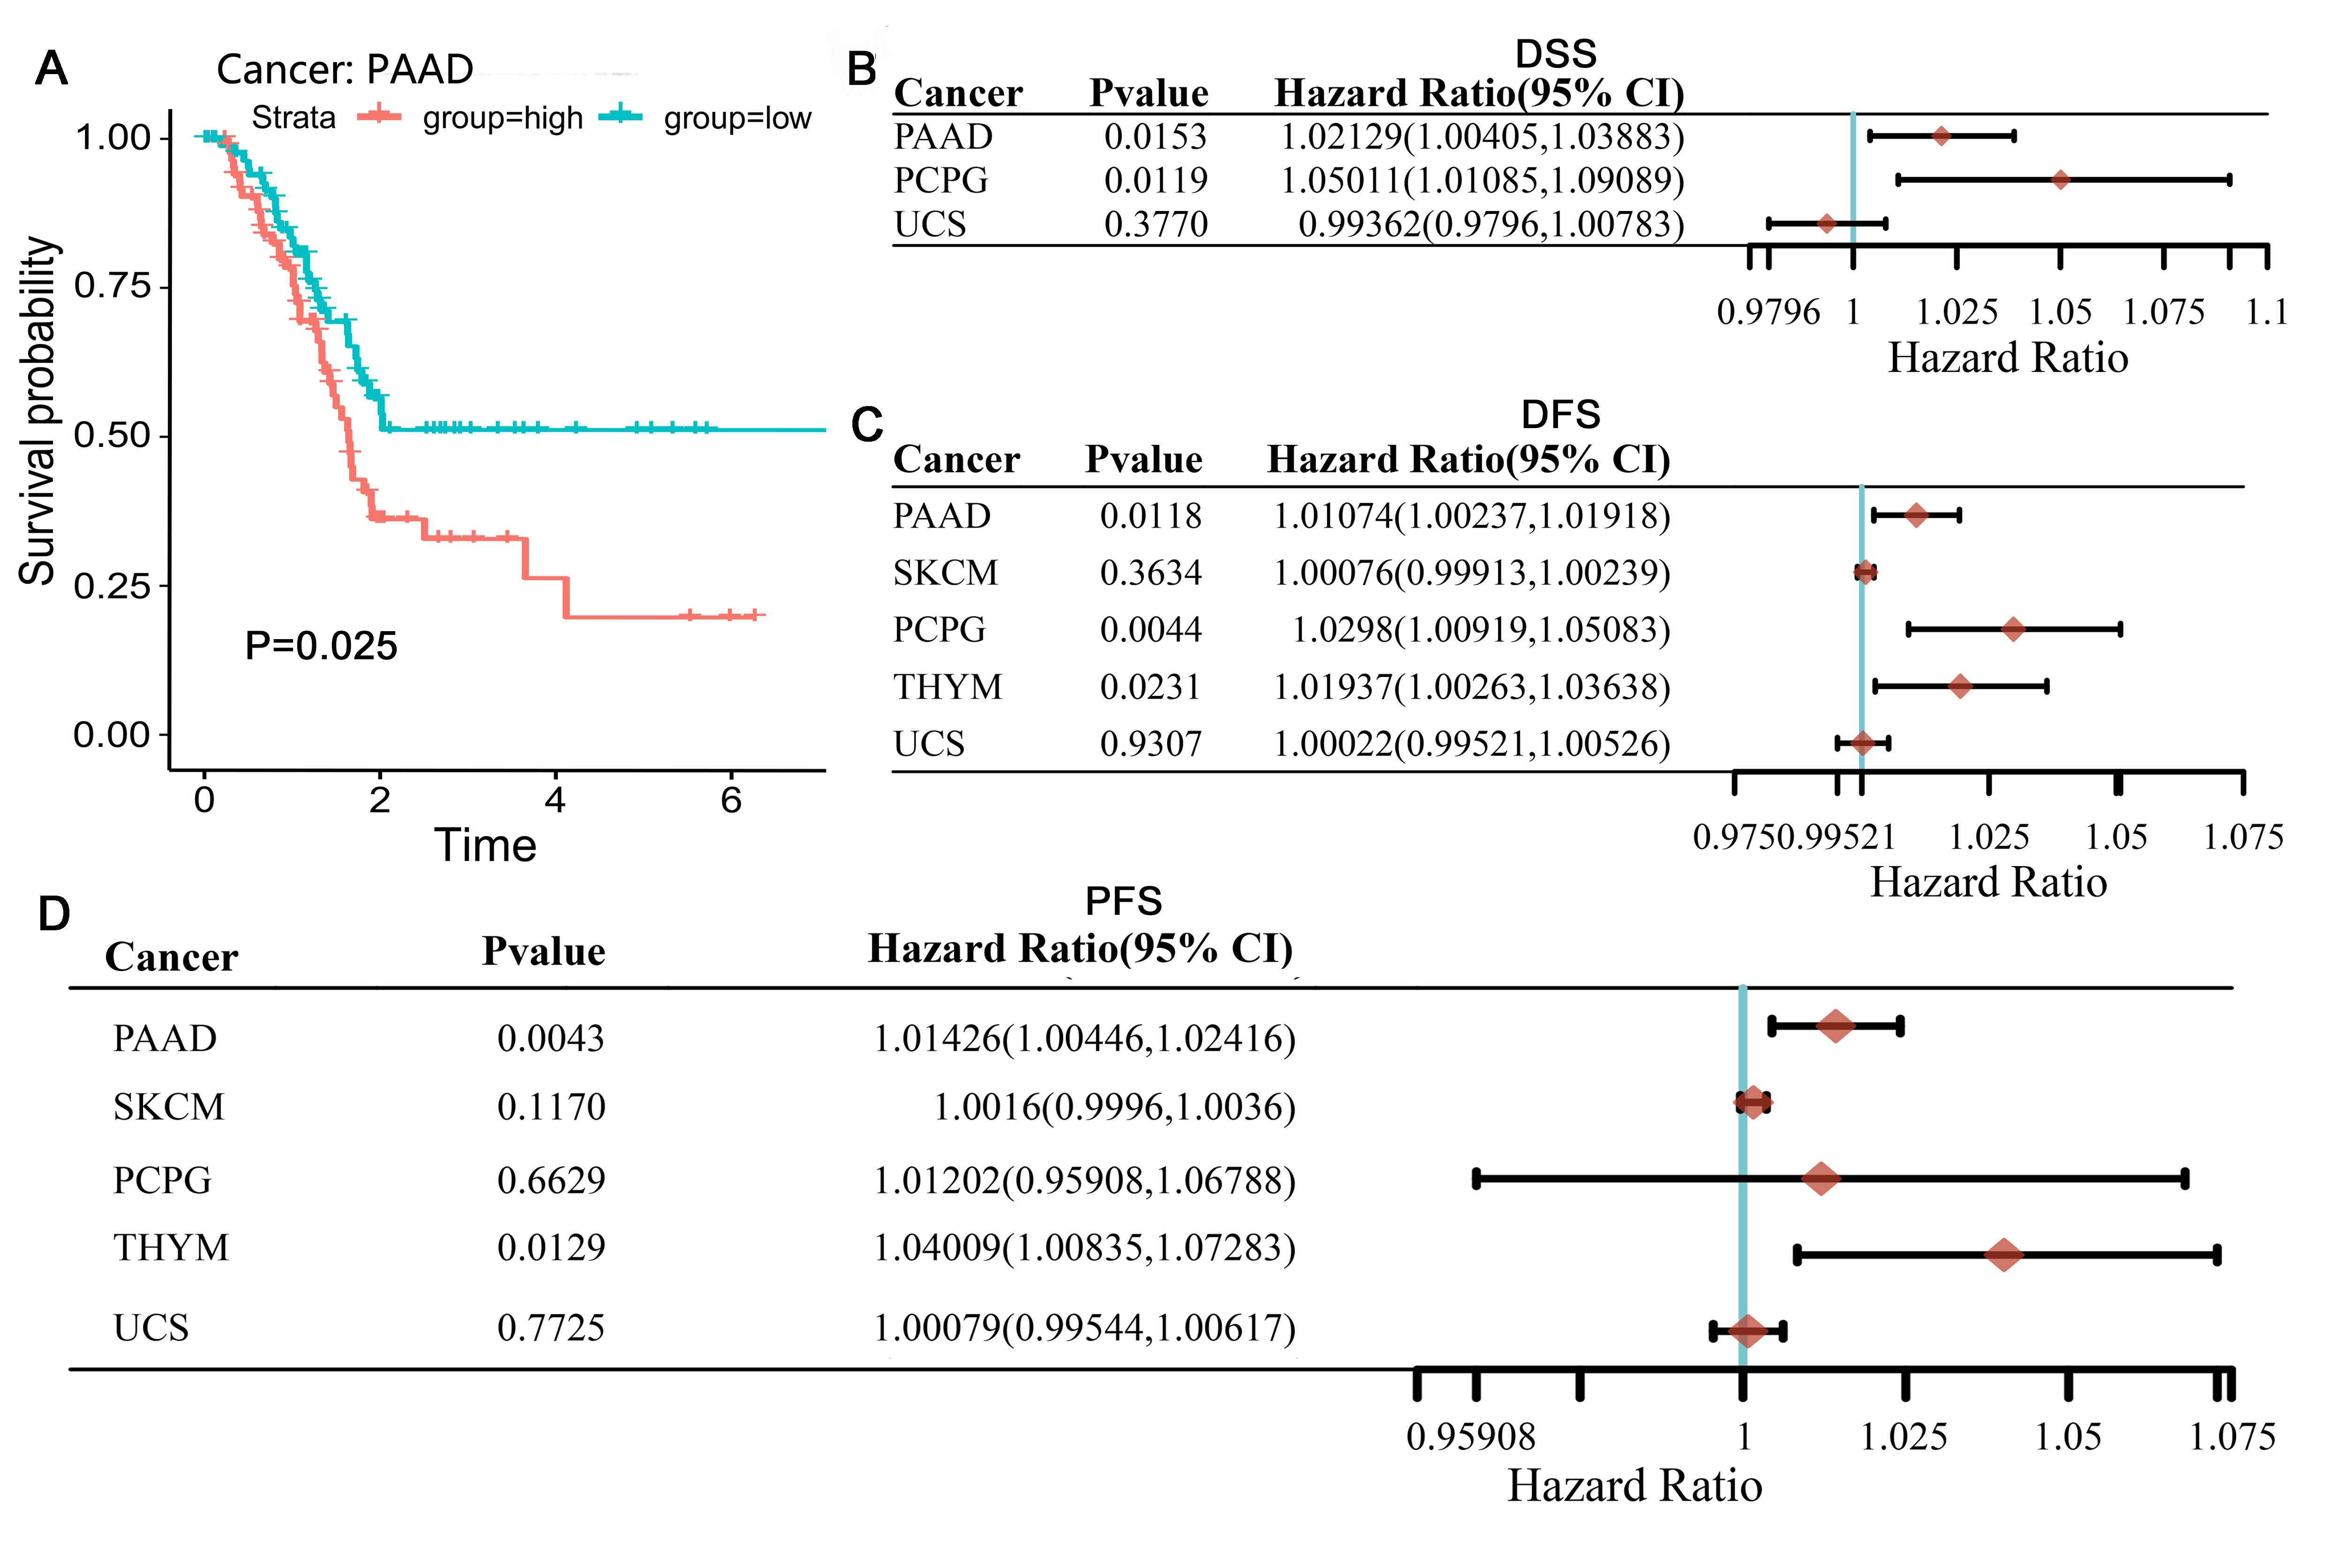
Figure 2. Comparison of DSS, DFI and PFI survival curves of
TFRC high and low expression in different cancers. A: High TFRC expression had
poor DSS in PAAD. (B–D) Prognostic HR of TFRC in different cancers for DSS (B),
DFI (C), PFI (D).
Correlation between TFRC
and the clinical characteristics of PAAD patients
We used the association between TFRC expression and different clinicopathological features of PAAD using 178 samples from the TCGA database. We divided these samples into high and low expression groups based on the median value of TFRC expression and then analysed the association between TFRC expression levels and clinical characteristics using Fisher's exact and chi-squared tests. We found that there was no significant relationship between TFRC expression levels and survival, smoking, tumour grade (Figure 3A, p> 0.05), sex, or T stage (Figure 3A, p <0.1) but a significant relationship with a history of alcohol consumption and lymph node metastasis (Figure 3B-C, p <0.001). Meanwhile, a higher level of lymph node metastasis corresponded with increased TFRC levels in PAAD patients, whereas PAAD patients with a history of alcohol consumption had lower TFRC levels in vivo than those with no history of alcohol consumption.
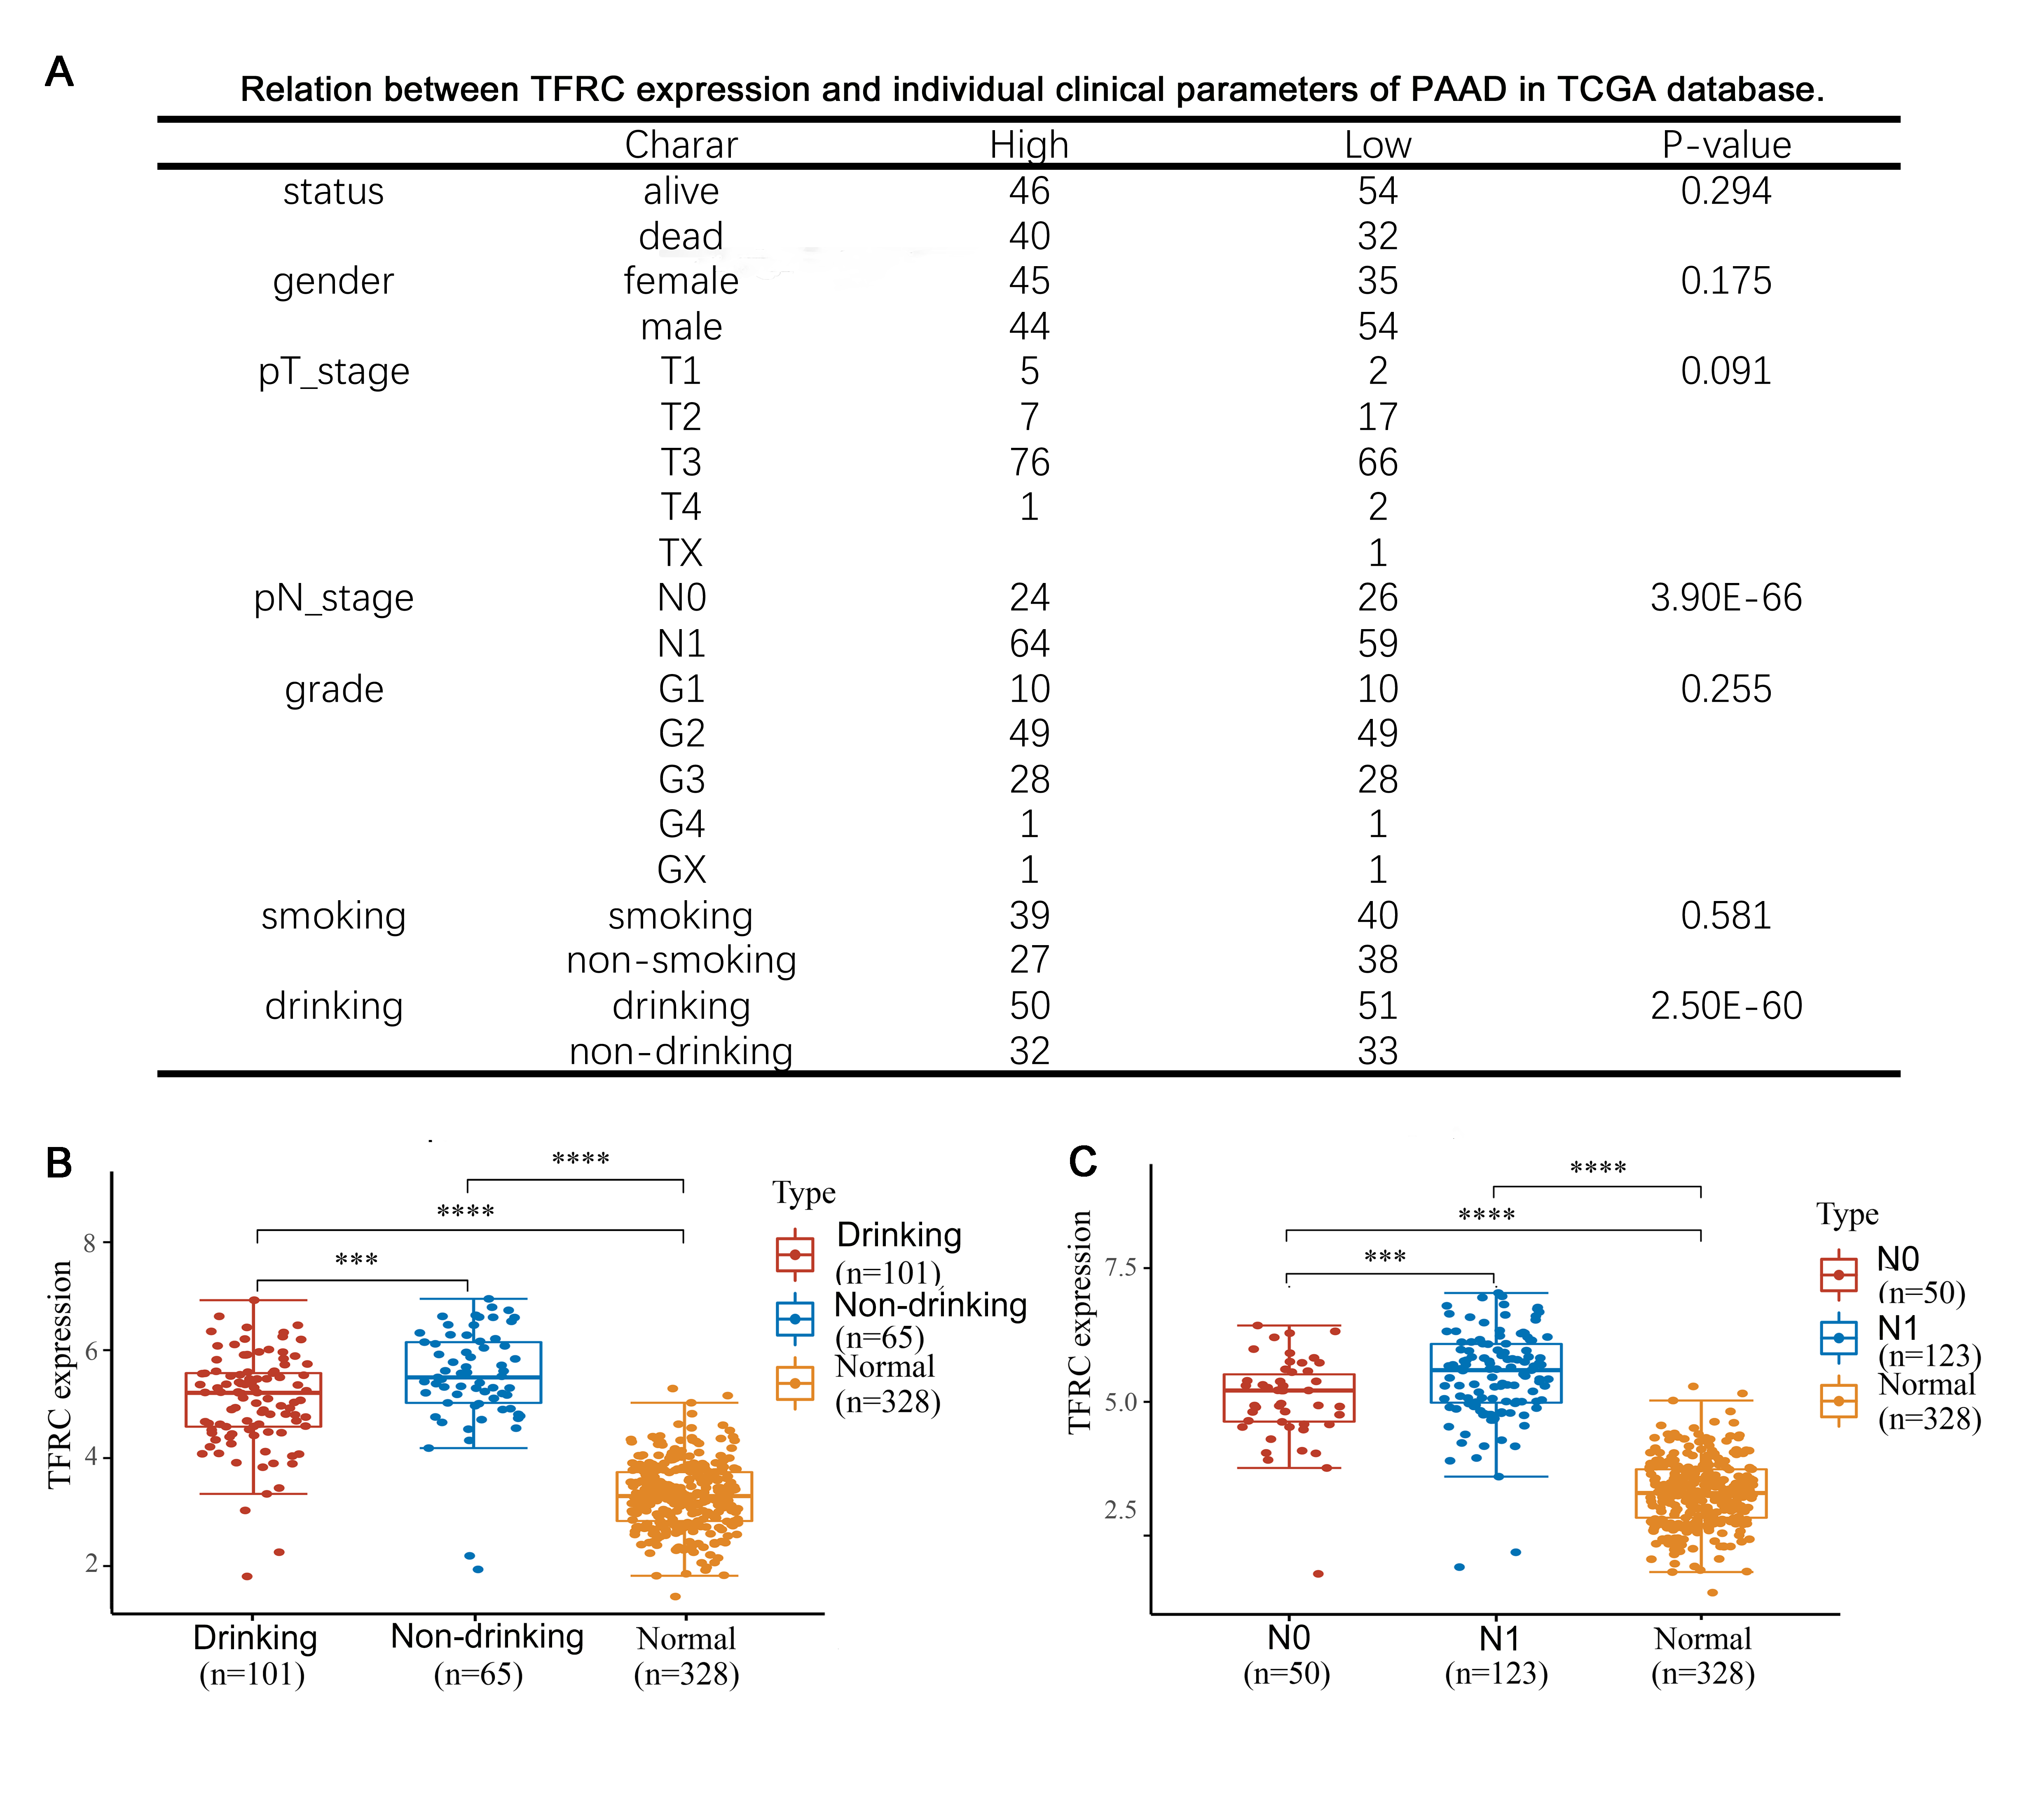
Figure3. Correlation of TFRC expression and prognosis in
PAAD with different clinicopathological factors. A: Relation between TFRC
expression and prognosis in PAAD with different clinicopathological factors in
in TCGA database. (B-C) TFRC expression was remarkably correlated with PAAD
patients’nodal metastasis (B) and a history of alcohol consumption(C).
TFRC expression was correlated with the immune
infiltration of the tumour microenvironment in PAAD
We performed an analysis of the correlation between the expression level of TFRC and the level of immune infiltration in PAAD. First, we analyzed differential expression of immune checkpoint genes in high and low TFRC expression samples and we found that the levels of CD274 (p <0.001), CTLA4 (p <0.01), HAVCR2 (p <0.01), PDCD1LG2 (p <0.01) and TIGIT (p <0.01) were significantly higher in the TFRC high expression group, suggesting that high expression of TFRC promoted the inhibition of immune cell function and increased the ability of tumours to evade the immune system (Figure 4A). We also tested our results obtained above with a gene coexpression heatmap. Next, we analysed the differences in the immune cell counts in specimens with high and low TFRC expression using immune scores and showed that the CD4+ content (p<0.05), macrophage count (p<0.05) and uncharacterized T cells (p<0.05) were correlated with TFRC expression (Figure 4B). Finally, we evaluated the correlation of TFRC expression levels with various immune cells using samples from the TCGA database. In PAAD, TFRC expression levels were compared with the counts of the following cells: CD4+ T cells (R=0.23, p<0.01) (Figure 4D), CD8+ T cells (R= -0.17, p<0.05) (Figure 4E), dendritic cells (R=0.21, p<0.01) (Figure 4F), mast cells (R= -0.26, p<0.001) (Figure 4G), macrophages (R=0.17), p<0.01) (Figure 4H) and uncharacterized cells (R=0.23, p<0.01) (Figure 4I) The above analysis suggests that TFRC can act as an immune infiltration modulator in PAAD.
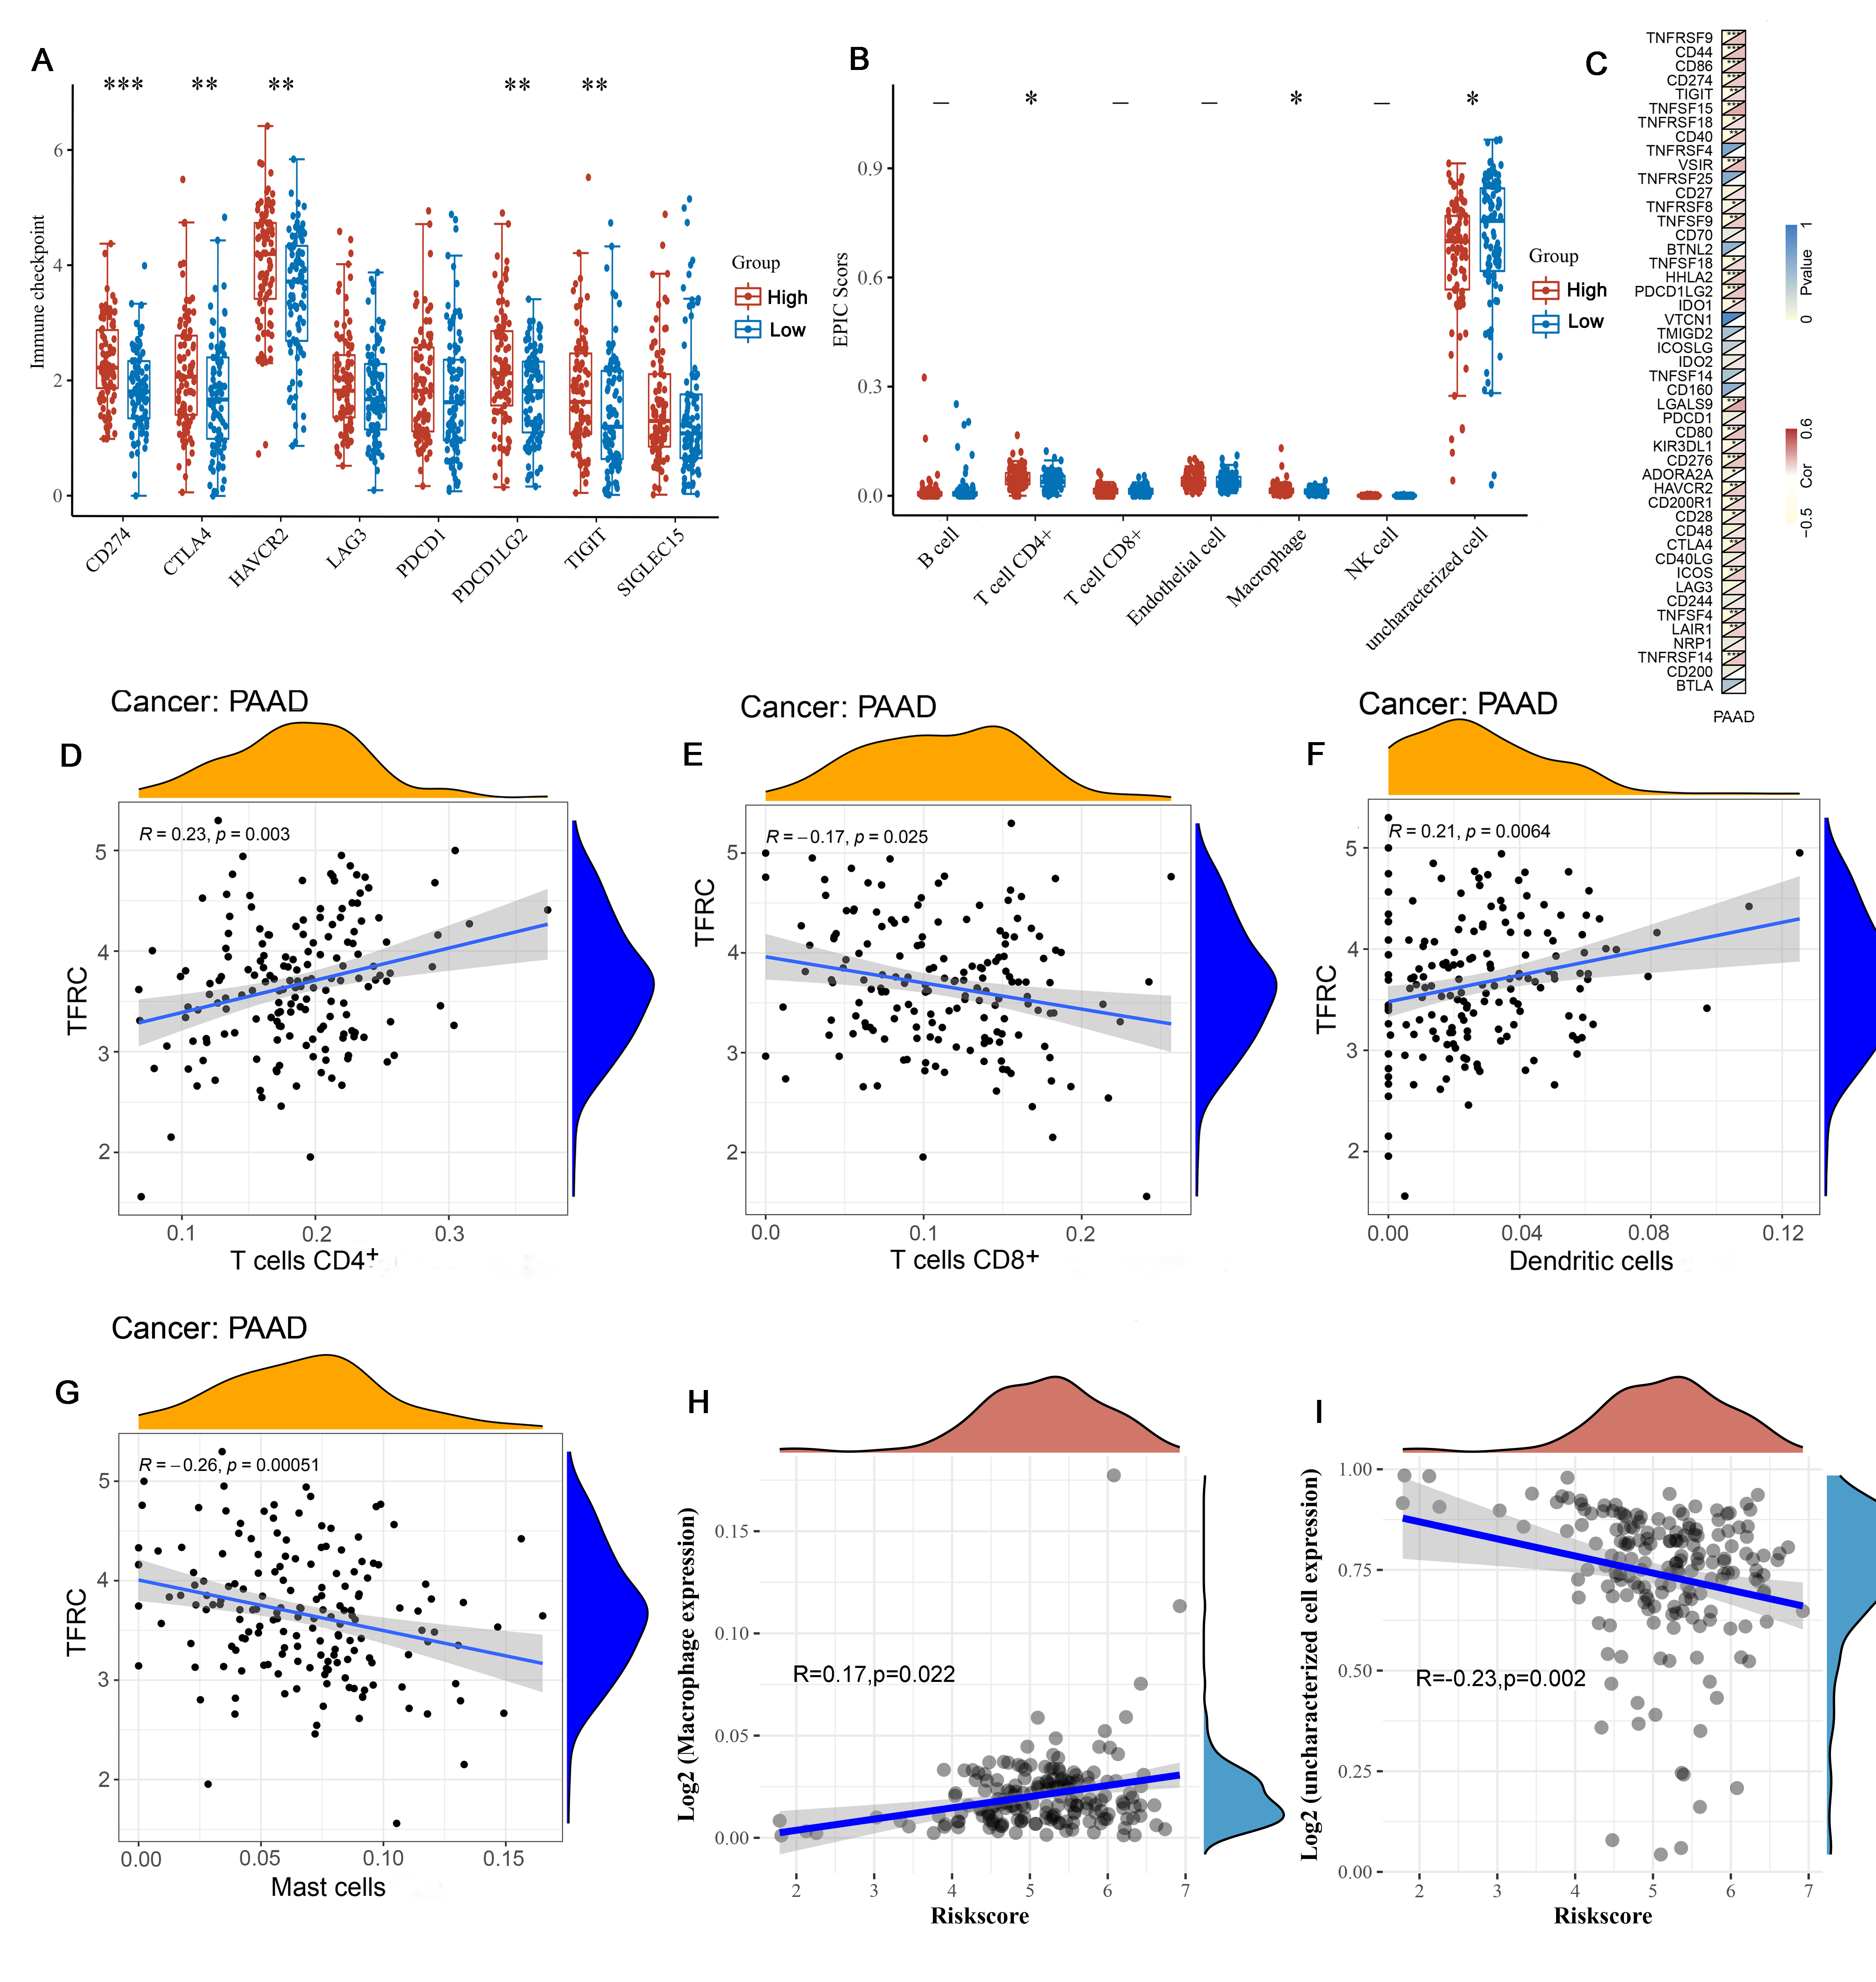
Figure 4. Correlation analysis of TFRC level with immune
checkpoint, immune scores and immune cells infiltration levels in human PAAD.
A: Correlation analysis of TFRC level and immune checkpoint by TCGA database.
B: Correlation analysis of TFRC level and immune scores in human PAAD. C: gene
co-expression heatmap. (D-I) Correlation analysis of TFRC level immune cells
infiltration levels. TFRC expression in PAAD tissues correlates with tumor
immune infiltration levels of CD4+ T cells (D), CD8+ T cells (E), dendritic cells
(F), mast cells (G), macrophages (H) and uncharacterized cells (I).
Effects of TFRC expression on the tumour
microenvironment
It has been found that TMB can be predicted as a novel effective biomarker for immunotherapy in various tumours. Therefore, we used the TCGA dataset to analyse the relationship between TFRC expression and TMB in PAAD. The results showed that the TMB was positively associated with TFRC expression levels (Figure 5A, p <0.01). Next, we investigated the relationship between microsatellite instability and TFRC expression levels but found no correlation between the two (Figure 5B, p> 0.05). In addition, we analysed differences in the expression of molecules associated with ferroptosis, such as CDKN1A, HSPA5, EMC2, SLC7A11 and NFE2L2, and found that they were significantly associated with TFRC expression (Figure 5C, p <0.001). Next, we identified a significant correlation between TFRC expression and the m6A molecules VTRMA, RBM15, ZC3H13, YTHDC1 and YTHDC2 (Figure 5D, p <0.001). Finally, we further validated our results from the GEO database (Figure 5E-F).
Figure 5. Correlation analysis of TFRC level with TMB,
microsatellite instability, the molecules associated with ferroptosis and the
m6A molecules in human PAAD. A: The relationship between TFRC expression and
TMB in PAAD. B: The relationship between microsatellite instability and TFRC
expression levels. C: The expression of molecules associated with ferroptosis
were associated with TFRC expression. D: Correlation between TFRC expression
and the m6A molecules. (E-F) Correlation analysis of TFRC level with the molecules
associated with ferroptosis (E) and the m6A molecules (F) across human PAAD and
normal tissue using the GEO database.
Effect of TFRC expression and clinical factors on
prognosis
We evaluated 178
PAAD samples from the TCGA database to determine the correlation of TFRC
expression and clinicopathological factors with OS using univariate Cox
regression. The results showed a significant correlation of TFRC (HR=1.44,
p<0.01), age (HR=1.02, p<0.01), pT_stage (HR=1.55, p<0.05), pN_stage
(HR=2.15, p<0.01), grade (HR=1.45, p<0.05) and primary tumour (HR=1.39,
p<0.05) with OS of PAAD (Figure 6A). Notably, pN_stage corresponded with the
highest risk. Multivariate Cox regression analysis of OS suggested that
pT_stage and primary tumour could act as independent prognostic factors (Figure
6B). Next, we generated an OS nomogram in the group that predicted the 1-, 2-
and 3-year OS rates of PAAD patients (Figure 6 C). To
further verify our results, we also generated calibration curves for the
nomogram model. The ideal curve is indicated by diagonal dashed lines, while
the nomogram of the observed 1-year OS rate is indicated by red lines (Figure
6D).
Figure 6. Univariate and multivariate Cox analyses of
clinical parameters and a nomogram for overall survival in PAAD. A: Correlation
of TFRC expression and clinicopathological factors with OS by univariate Cox
regression. B: Correlation of TFRC expression and clinicopathological factors
with OS by multivariate Cox regression. C: A nomogram for overall survival in
PAAD. D: Calibration curves for the nomogram model.
TFRC affects signalling pathways associated with the
occurrence and development of PAAD
We classified the PAAD samples into high and low expression groups based on the median expression value of TFRC, and GSEA of the PAAD samples revealed the five most significantly enriched signal pathways. The results showed that TFRC regulates PAAD occurrence through signalling pathways associated with endothelial cell proliferation, blood vessel endothelial cell migration, G1/S transition of mitotic cell cycle, cell migration involved in sprouting angiogenesis and vascular endothelial cell proliferation (Figure 7).
Figure 7. Molecular function of TFRC in PAAD.A-D: Gene
ontology (GO).
Discussion
Pancreatic cancer is one of the deadliest
tumours of all cancers and has a poor prognosis. Therefore, it is important to
understand the prognostic factors and molecular mechanisms underlying the
occurrence and development of PAAD in order to promote effective treatment.
Ferroptosis is a novel mode of non-apoptotic cell death. Increasing studies
have confirmed that ferroptosis plays an important role in cancer progression.
Many studies have investigated the role of ferroptosis-related genes in
pancreatic cancer. Xu et al. reported that PTGS2 and SQLE have cancer-promoting
capacity in PAAD [22]. Another study suggested that the combination of
artesunate with GRP78 inhibition is a novel method for effectively killing
KRAS-mutant pancreatic ductal adenocarcinoma cells [23]. Subsequent studies
identified microsomal glutathione-S-transferase 1 (MGST1) as a target gene of
NRF2 involved in inhibiting the progression of ferroptosis in pancreatic cancer
cells [24].
Although several studies have revealed the
pathophysiological role of ferroptosis-related genes in pancreatic cancer, it
is more likely that there are dozens of combinations of ferroptosis-related
genes that affect PAAD, especially in PAAD prognostic studies. TFRC is a
membrane protein involved in mediating intracellular iron transport. In this
study, we analysed for the first time the prognostic value of TFRC expression
in PAAD and its correlation with immune infiltration and the tumour
microenvironment using specimens from the TCGA, GTEx, Oncomine and GEO
databases.
In this study, we confirmed that the
expression of TFRC was significantly increased in tumour tissues from PAAD
patients compared with normal tissues (Figures 1–2). In addition,
overexpression of TFRC correlated with lymph node metastasis in PAAD (Figure
3C). Our results suggest an important role of TFRC in the occurrence and
development of PAAD. Our results are the same as those described in a previous
work [6]. TFRC contributes to the proliferation and metastasis of epithelial
ovarian cancer cells [7]. These results strongly suggest that TFRC acts by
promoting tumour proliferation and metastasis.
The results from the survival analysis
showed that patients with high TFRC expression exhibited significantly worse
OS, DSS, PFE and DFS than those with low TFRC expression (Figure 1C) (Figure
2A), which is consistent with previous findings. Epigenetic silencing of the
TFRC gene was shown to reduce the growth and survival of HCC cells [8].
It was previously reported that TFRC can
regulate the tumour microenvironment. Using an immunocorrelation analysis, we
found that TFRC expression is positively associated with macrophages and
dendritic cells in PAAD, suggesting that TFRC is involved in the regulation of
immune cells in the tumour microenvironment in PAAD. Furthermore, according to
our findings, TFRC expression is associated with the expression of multiple
immune checkpoint-related genes in PAAD. We hypothesized that TFRC is able to
promote immune escape of tumour cells. Consistent with our findings, Sun Jiarui
et al. stated that the iron restriction imposed by cancer cells drives the
polarization of macrophages toward an immunosuppressive M2 phenotype, thereby
inhibiting antitumour immunity [25]. We further discovered a significant
association of TFRC expression with TMB, ferroptosis, and m6A in PAAD.
Univariate and multivariate Cox analyses showed that low TFRC expression was
associated with a good prognosis in PAAD patients, indicating that TFRC may be
a potential prognostic indicator for PAAD patients.
Using GSEA, TFRC was observed to regulate
PAAD occurrence through multiple pathways (endothelial cell proliferation and
blood vessel endothelial cell migration) that have been implicated in cell
proliferation and migration. Therefore, we hypothesized that TFRC plays a role
in PAAD progression by promoting cancer cell proliferation and metastasis.
Although the specific mechanism of action of TFRC in PAAD in this study was not
fully clarified and but was rather intimated based on a pure raw data analysis (which
may have some limitations), we provide a novel direction for exploring the role
of TFRC in PAAD. Taken together, our findings suggest that TFRC is a potential
prognostic indicator and a novel therapeutic target for PAAD.
Conclusion
In conclusion, we
observed differential expression of TFRC and its associated genes between
tumour tissue and normal pancreatic tissue in PAAD patients, suggesting the
potential for TFRC as a prognostic indicator and novel therapeutic target in
PAAD.
Data Availability Statement
Data collection
and processing were performed according to the policies of the TCGA project,
GTEx, Oncomine and GEO databases.
Funding
Conflict of Interest
References
1. Wei EY and Hsieh JJ:
A river model to map convergent cancer evolution and guide therapy in RCC.
Nature Reviews Urology 12: 706, 2015.
2.
Funakoshi T, Lee C-H and Hsieh JJ: A systematic review of predictive and
prognostic biomarkers for VEGF-targeted therapy in renal cell carcinoma. Cancer
Treatment Reviews 40: 533-547, 2014.
3.
Motzer RJ, Hutson TE, Tomczak P, et al.: Sunitinib versus Interferon Alfa in
Metastatic Renal-Cell Carcinoma. New England Journal of Medicine 356: 115-124,
2007.
4.
Escudier B, Pluzanska A, Koralewski P, et al.: Bevacizumab plus interferon
alfa-2a for treatment of metastatic renal cell carcinoma: a randomised,
double-blind phase III trial. The Lancet 370: 2103-2111, 2007.
5.
Takayama S, Sato T, Krajewski S, et al.: Cloning and functional analysis of
BAG-1: a novel Bcl-2-binding protein with anti-cell death activity. Cell 80:
279-284, 1995.
6.
Papadakis ES, Reeves T, Robson NH, Maishman T, Packham G and Cutress RI: BAG-1
as a biomarker in early breast cancer prognosis: a systematic review with
meta-analyses. British Journal Of Cancer 116: 1585, 2017.
7.
Cutress RI, Townsend PA, Brimmell M, Bateman AC, Hague A and Packham G: BAG-1
expression and function in human cancer. British Journal Of Cancer 87: 834,
2002.
8.
Townsend PA, Dublin E, Hart IR, et al.: BAG-i expression in human breast
cancer: interrelationship between BAG-1 RNA, protein, HSC70 expression and
clinico-pathological data. The Journal of pathology 197: 51-59, 2002.
9.
Southern SL, Collard TJ, Urban BC, et al.: BAG-1 interacts with the p50–p50
homodimeric NF-κB complex: implications for colorectal carcinogenesis. Oncogene
31: 2761, 2011.
10. Liu
S, Ren B, Gao H, et al.: Over-expression of BAG-1 in head and neck squamous
cell carcinomas (HNSCC) is associated with cisplatin-resistance. Journal of
translational medicine 15: 189-189, 2017.
11.
Davidson B, Valborg Reinertsen K, Trinh D, Reed W and Bohler PJ: BAG-1/SODD,
HSP70, and HSP90 are potential prognostic markers of poor survival in
node-negative breast carcinoma. Human pathology 54: 64-73, 2016.
14.
Subramanian A, Tamayo P, Mootha VK, et al.: Gene set enrichment analysis: a
knowledge-based approach for interpreting genome-wide expression profiles.
Proceedings of the National Academy of Sciences 102: 15545-15550, 2005.
15.
Wu H and Zhang J: Decreased expression of TFAP2B in endometrial cancer predicts
poor prognosis: A study based on TCGA data. Gynecologic oncology 149: 592-597,
2018.
16.
Huang B, Zhou H, Lang X, Liu Z, Xiong F and Wang S: Expression of BAG-1 is
closely related to cell differentiation and TNM stage in esophageal cancer and
its downregulation inhibits the proliferation and invasion of human esophageal
carcinoma cells. Oncol Rep 32: 1441-1446, 2014.
17.
Yang J, Cai Z, Du W, Li J, Chen T and Xu Y: The relationship between Bag-1 and
gastric cancer clinicopathologic characteristic. The Chinese-German Journal of
Clinical Oncology 10: 459, 2011.
18.
Jodoin R, Perreault J-P and Bisaillon M: Abstract A08: A 5'UTR RNA G-Quadruplex
structure affects both the cap-dependent and independent translation of BAG-1,
an mRNA involved in colorectal cancer. AACR2017.
19.
Shen Z, Li Y, Zhao C, Wang F, Zhou R and Chen G: miR‑494‑BAG‑1 axis is involved in
cinobufacini‑induced cell proliferation and apoptosis in gastric cancer.
Molecular medicine reports 17: 7435-7441, 2018.
20.
Cato L, Neeb A, Sharp A, et al.: Development of Bag-1L as a therapeutic target
in androgen receptor-dependent prostate cancer. Elife 6: e27159, 2017.
21.
Galvan V, Brandimarti R, Munger J and Roizman B: Bcl-2 blocks a
caspase-dependent pathway of apoptosis activated by herpes simplex virus 1
infection in HEp-2 cells. Journal of virology 74: 1931-1938, 2000.
22.
Wang HG, Takayama S, Rapp UR and Reed JC: Bcl-2 interacting protein, BAG-1,
binds to and activates the kinase Raf-1. Proceedings of the National Academy of
Sciences of the United States of America 93: 7063-7068, 1996.
23.
van der Zee JA, Ten Hagen TL, Hop WC, et al.: Bcl-2 associated anthanogen-1
(Bag-1) expression and prognostic value in pancreatic head and periampullary
cancer. European journal of cancer (Oxford, England : 1990) 49: 323-328, 2013.
24.
Ni W, Chen B, Zhou G, et al.: Overexpressed nuclear BAG-1 in human
hepatocellular carcinoma is associated with poor prognosis and resistance to
doxorubicin. Journal of cellular biochemistry 114: 2120-2130, 2013.
25.
Liberman EA, Topaly VP, Tsofina LM, Jasaitis AA and Skulachev VP: Mechanism of
Coupling of Oxidative Phosphorylation and the Membrane Potential of
Mitochondria. Nature 222: 1076-1078, 1969.
26.
Xu, Jing, Nie, et al.: Down-regulated energy metabolism genes associated with
mitochondria oxidative phosphorylation and fatty acid metabolism in viral
cardiomyopathy mouse heart. Molecular Biology Reports 38: 4007-4013, 2011.